Tick-level historical data
Run tests against bid/ask tick data for major FX pairs, equity indices, and crypto assets. Data covers from 2010 onwards for most instruments, with no downsampling to OHLC unless you choose it.

Backtesting Engine
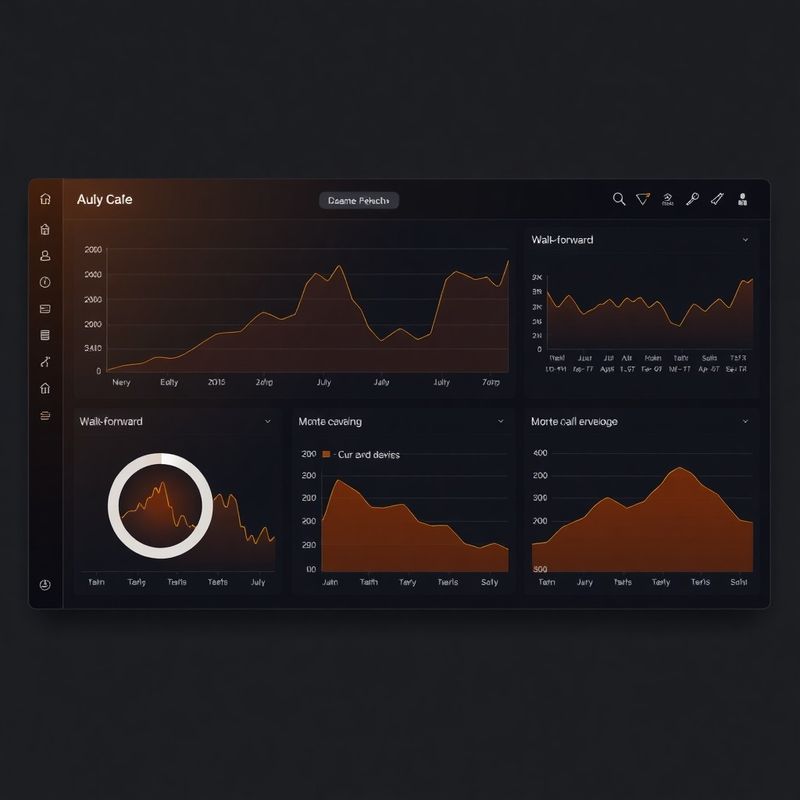
Whitaker's backtesting engine runs walk-forward and Monte Carlo tests against tick-level data so you know what you own before you deploy it live.
Slippage models, commission schedules, and funding costs — not just raw price series.
Most backtests look better than live trading because they ignore the things that cost money: slippage on market orders, spread widening during news releases, broker commissions that compound across hundreds of round trips, and overnight funding charges on leveraged positions. Whitaker's engine lets you configure a slippage model (fixed, percentage, or volume-based), set per-trade commission in the currency and structure your broker actually charges, and apply swap rates for overnight carries. The result is a simulation that disagrees with your intuition in useful ways — surfacing strategies that survive friction rather than ones that merely look clean on a chart.
Tick-level granularity. Configurable assumptions. Exportable results.
Run tests against bid/ask tick data for major FX pairs, equity indices, and crypto assets. Data covers from 2010 onwards for most instruments, with no downsampling to OHLC unless you choose it.
Avoid curve-fitting by splitting your data into optimisation and out-of-sample windows automatically. Results show how parameter choices degrade as market conditions shift.
Generate thousands of randomised trade-sequence permutations to stress-test drawdown expectations. Gives you a realistic distribution of outcomes, not a single optimistic equity curve.
Download full backtesting results as a structured CSV or view the summary statistics — Sharpe, Sortino, max drawdown, win rate — directly in the slate-professional monitoring dashboard.
A concrete set of artefacts, not just a chart screenshot.
At the end of each backtest run you receive: a trade-by-trade log with entry price, exit price, P&L net of simulated costs, and the specific signal that triggered the trade; a summary statistics sheet covering the full test window and each walk-forward segment separately; a drawdown chart with the five largest peak-to-trough sequences annotated; and a Monte Carlo envelope showing the 10th, 50th, and 90th percentile equity curves across 1,000 random permutations. All files are stored in your account for 90 days and can be re-run against an updated data set at any time without reconfiguring the test parameters from scratch.
“I ran the same strategy through three different backtesters before Whitaker. The others showed a Sharpe of 1.8; Whitaker's realistic slippage model brought it to 1.1. That difference kept me from deploying with too much capital. I still use the strategy — just sized correctly.”
Elena Popa, futures trader, Bucharest
Start a backtesting run on the Starter plan — no long-term commitment required.