Live P&L across accounts
Consolidated unrealised and realised P&L in your base currency, updated on every fill. Per-strategy and per-instrument breakdowns available with a single click.

Monitoring Dashboard
Whitaker's slate-professional monitoring dashboard gives you live visibility across every connected broker, every active strategy, and every filled order.
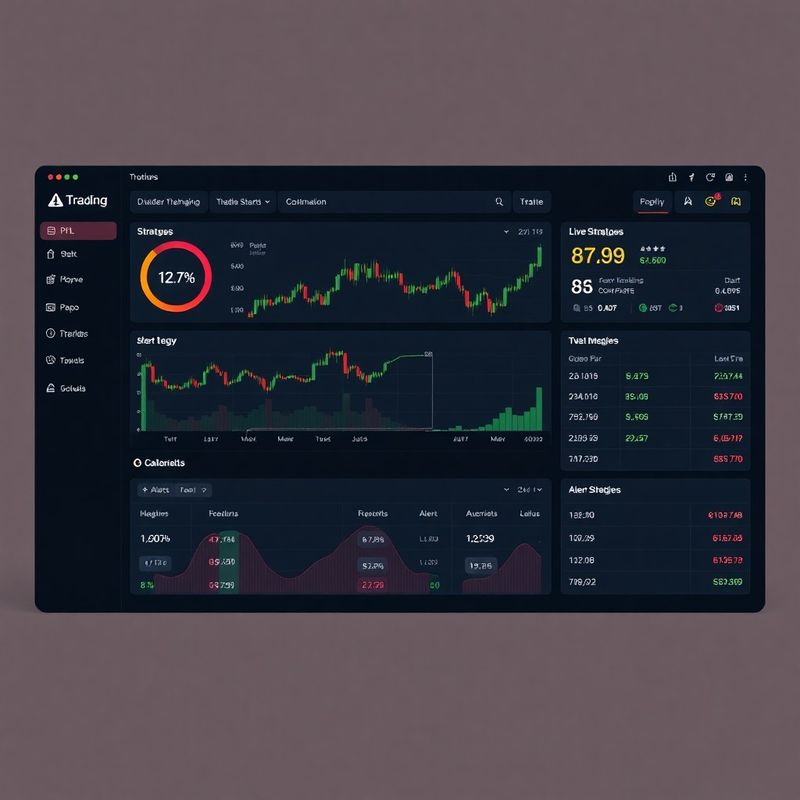
No tab-switching between broker portals — one consolidated view, always current.
The Whitaker monitoring dashboard aggregates live data from all your connected broker accounts into a single interface. The left panel shows consolidated P&L in your chosen base currency, updated on each new fill or position change. The centre panel displays active strategies with their current state — running, paused, blocked by a risk limit, or waiting for next trigger — alongside a real-time latency metric for each broker connection. The right panel shows the alert feed: risk blocks, missed fills, connection drops, and manual overrides, each with a timestamp and one-click drill-down into the full event log. The interface is built in a clean slate-professional palette — dark chrome accents on a neutral grey base — designed to read clearly on both a wide monitor and a tablet during travel.
Configured to show what matters, not everything at once.
Consolidated unrealised and realised P&L in your base currency, updated on every fill. Per-strategy and per-instrument breakdowns available with a single click.
Median and 95th-percentile order-to-fill latency per broker, charted over the last 24 hours. Spikes above your configured threshold trigger an alert before they affect execution quality.
Every order placed through Whitaker — filled, partially filled, rejected, or cancelled — is searchable by instrument, strategy, date range, and broker. Exportable as CSV for tax records or personal review.
The dashboard re-flows to a single-column layout on screens below 768px. Key metrics — net P&L, active strategy count, and latest alert — are pinned at the top so you see what matters first on a phone.
A monitoring tool should show you truth, not filter it.
The dashboard does not smooth P&L curves, delay loss notifications, or present equity as a rolling average to make drawdowns look smaller. It shows raw account state. Some traders find this uncomfortable at first — seeing a strategy in a temporary drawdown clearly displayed can prompt impulsive intervention. We have kept the display unfiltered intentionally because the alternative, a dashboard that makes everything look fine until it suddenly does not, is more dangerous. The platform also does not provide trade signals or strategy recommendations. What you see is a faithful read-out of what your strategies are doing; the strategic decisions remain yours.
Book a 20-minute screen-share with the Brașov team — no sales pitch, just the real interface.